Marsh Data Revolution
Marsh Data Revolution
Rain lashed against my waders as I stood waist-deep in Louisiana's Atchafalaya Basin, the stench of decaying cypress roots thick in my nostrils. My handheld spectrometer blinked error codes while the clipboard holding my pH readings floated away downstream. That moment of utter despair - ink bleeding through rain-sodden paper, $15k equipment failing mid-transect - ended when I fumbled my phone from its waterproof case. With mud-caked fingers, I tapped the icon that would become my lifeline.
The transformation felt like swapping a horse-drawn plow for a GPS-guided tractor. Suddenly, seven different instruments synced through Bluetooth Low Energy mesh networking, their readings materializing in vibrant graphs on my screen. No more frantic scribbling as dragonflies dive-bombed my neck; the app's haptic feedback confirmed each measurement capture. I watched dissolved oxygen levels plummet in real-time as an algal bloom swept through the oxbow - data that previously took weeks to correlate now unfolding live before my eyes.
What truly shattered my old workflow was the spectral analysis module. Remembering how I'd once ruined $800 worth of nitrate test kits by dropping them in brackish water, I nearly wept when the app processed hyperspectral data from my drone's downward sensor. The machine learning algorithms detected petroleum contaminants at 0.3ppm concentration - invisible to human eyes but flaring crimson on the heatmap overlay. That afternoon, we traced a leak to a corroded pipeline valve three miles upstream, something my old clipboards-and-guesswork approach would've missed entirely.
Field validation became almost visceral. I'd plunge a multi-parameter sonde into tannin-dark waters, feeling vibrations travel up the cable as the app calibrated for turbidity interference. The satisfaction when its adaptive sensor fusion compensated for Mississippi River sediment load? Better than bourbon after a 14-hour shift. During hurricane season, when cell towers drowned, the app's local SQLite database preserved 72 hours of readings - salvation when FEMA demanded immediate water toxicity reports.
Yet the magic happened during predawn samplings. Hip-deep among water hyacinths, phone mounted on my chest rig, I'd watch the interface shift from indigo to gold as sunrise altered light refraction values. The app didn't just record data - it made me perceive aquatic systems as living, breathing entities. When sensors detected sudden pH crashes indicating acid mine drainage, the vibration pattern changed to urgent pulses against my sternum. No spreadsheet ever screamed warnings through bone conduction.
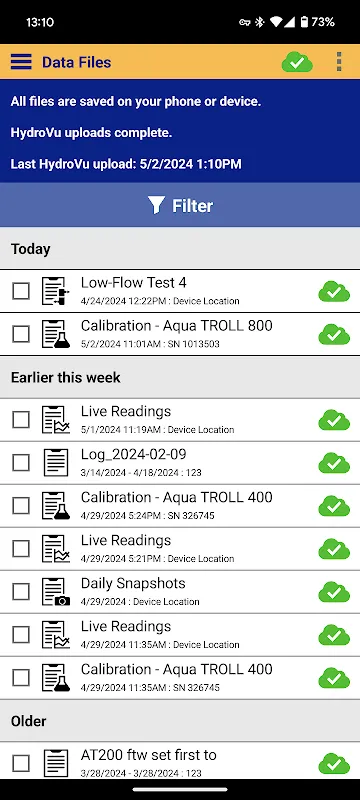
Critically, the app's cloud architecture nearly broke me during week three. Uploading 2GB of LiDAR hydrography data from a bayou, I watched progress crawl at 1% per hour until realizing the "background sync" default drained my satellite modem. That rage-fueled night birthed my custom Python script to batch-process field packages - a brutal lesson in edge computing limitations. Now I pre-crunch topobathy datasets before leaving the truck.
Last Tuesday epitomized the revolution. Knee-deep in gator territory, I coordinated with three other teams through the app's encrypted P2P chat. When Karen's group upstream flagged mercury spikes, my augmented reality overlay highlighted affected tributaries in real-time. We isolated the source - illegal battery dumping - before sunset. Ten years ago, that investigation would've taken months. As bullfrogs began their nightly chorus, I saved the final report with a mud-streaked thumb, tasting victory instead of bug spray.
Keywords:VuSitu,news,water quality analysis,environmental monitoring,field research technology


