When the Waves Finally Answered
When the Waves Finally Answered
My wetsuit hung heavy with betrayal, still dripping from yesterday's false alarm. I'd spent forty minutes wrestling into that second skin before dawn only to find Narragansett Bay flat as a parking lot – again. Salt crust stung my eyes as I kicked empty driftwood, imagining phantom swells that lured me across three counties. That's when Liam tossed his phone at me mid-rant, screen glowing with color-coded graphs over a map of Rhode Island's jagged coastline. "Stop guessing," he mumbled through a breakfast burrito. "Let the buoys talk."

First launch felt like cracking military code. Neon green arrows indicated wind direction while pulsing blues mapped swell intervals – 12 seconds meant serious energy. My finger trembled hovering over the Point Judith cam overlay, revealing real-time whitewater exploding over the outer reef. HopeWaves' secret sauce wasn't magic but math: cross-referencing NOAA buoy 44097's raw spectral data with tidal algorithms and wind friction coefficients. Suddenly, I understood why last Tuesday's promising southeast breeze died on arrival – the app visualized how Block Island's landmass shredded incoming energy like tissue paper.
Thursday's 5:47am alert vibrated under my pillow. The prediction looked too good: 3.5-foot groundswell at 14 seconds from 160 degrees. Perfect offshore winds. I nearly dismissed it until noticing the tiny wave model icon – not some generic animation, but a physics simulation rendering how each wave face would steepen as it hit the continental shelf. My dashboard became a cockpit: battery at 78%, drive time 52 minutes, water temp flashing 54°F in warning yellow. I threw my board in the truck watching dawn bleed crimson over the app's radar overlay, praying those little rain blobs stayed north.
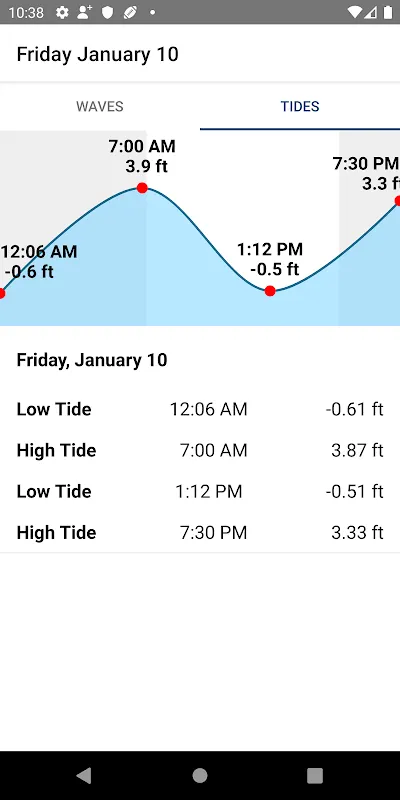
Screeching into East Matunuck's empty lot, I almost didn't look up. Muscle memory braced for disappointment. Then I heard it – the deep whomp of water collapsing on itself. Head-high lefts peeled down the sandbar with surgical precision, just like the prediction graph promised. That first duck dive shocked me: the app had even calculated the interval between sets. As a cleanup wave loomed, I remembered the tide chart's crimson spike indicating peak high tide in 23 minutes – right when this reef gets sketchy. Paddled toward channel just as mountains of water started detonating where I'd been sitting.
Not every forecast lands perfectly. Two weeks later, the tool insisted Ruggles was firing despite hurricane remnants churning the Atlantic. What arrived wasn't the promised glassy perfection but wind-chopped monstrosities. Later I'd learn why: the algorithm couldn't account for a freighter altering local currents at 4am. Still, watching twenty locals battle closeouts from the cliff, I appreciated the app's brutal honesty. Its "confidence meter" – usually a proud 90% – flashed a sheepish 55% that morning. The admission of uncertainty felt strangely human in a sea of tech hubris.
What changed wasn't just my wave count. It was how I experienced the coastline between surfs. Walking Newport's cliffs at sunset, I'd catch myself analyzing how the app's wave refraction models explained why certain coves gathered energy. Watching seabirds dive, I'd recall the subsurface bathymetry charts showing underwater canyons directing nutrients. Even my dreams got technical – one night I visualized spectral period data as glowing harp strings across the ocean's surface. The greatest gift wasn't saved gas money or epic sessions, but decoding the ocean's hidden syntax. When fog swallowed the horizon last month, I didn't panic. Just tapped the buoy readings tab, smiled at the steady 3-foot energy readings, and paddled blind into the abyss. The waves found me.
Keywords:HopeWaves,news,surf forecasting,ocean algorithms,Rhode Island coastline


